
Data Visualization
Top 10 Essential Data Visualization Best Practices

Data speaks a universal language, but the clarity of its message relies heavily on how it is visualized. Every choice in your data visualization design is pivotal, shaping how your audience interprets the information.
Here are 10 key best practices in data visualization to help you present your data in a way that is clear, impactful, and easily understood by your audience.
1. Understand Your Audience
- Tailor to Your Audience: The first step in designing any data visualization is knowing who will be viewing it. Whether your audience consists of executives, a sales team, or a general audience, your visualizations should be tailored to meet their specific needs and expectations.
- Purpose-Driven Design: Focus on what decisions you want your audience to make based on the data. The more you understand your audience's requirements, the more effective your visualizations will be.

Understanding your audience is the cornerstone of effective data visualization. To tailor your visualizations effectively, consider these key questions:
- Who is the visualization intended for?
- What type of decision do you want the audience to make (strategic, operational, or tactical)?
- What specific actions do you want them to take based on the insights provided?
By addressing these questions, you ensure that your data presentation aligns with your audience's needs, enhancing both clarity and impact.
2. Keep It Simple and Clear
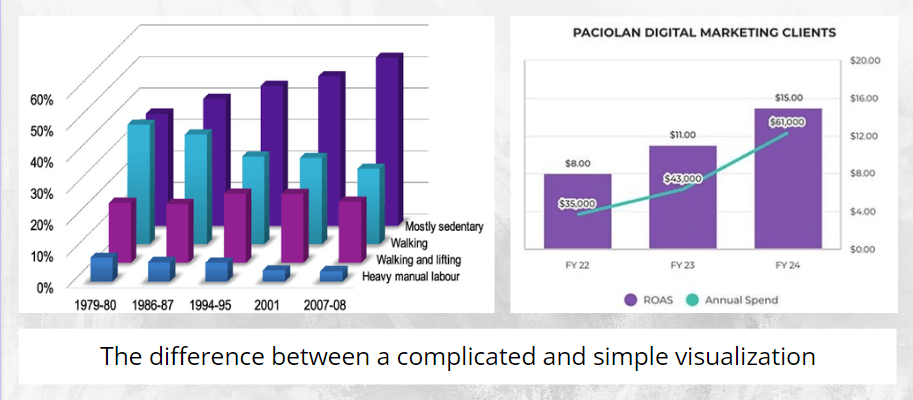
- Simplicity is Key: Overloading your visualizations with too much information can overwhelm your audience. Focus on displaying only the most relevant data points and eliminate any unnecessary clutter.
- Ease of Interpretation: Ensure that your visualizations are straightforward, allowing viewers to quickly grasp the key insights without getting lost in details.
3. Choose the Right Visualization Type
Match Data to Visualization: Different types of data call for different types of visualizations. For example, use:
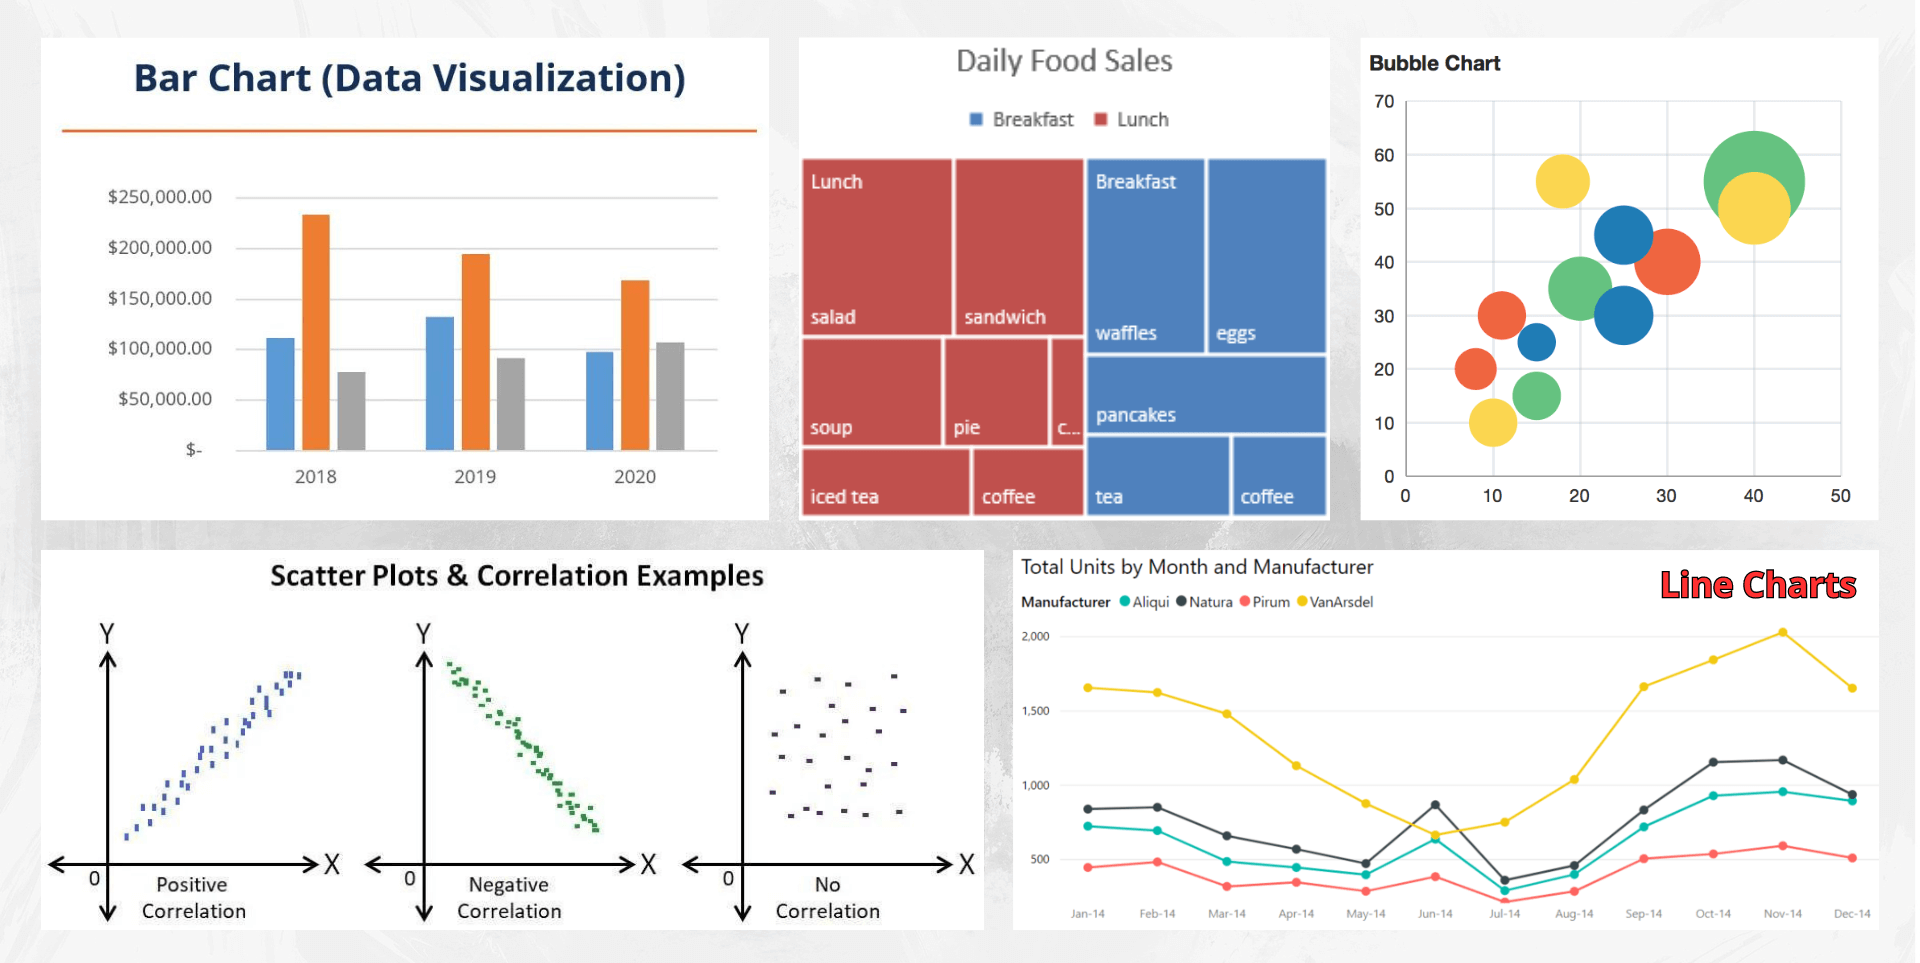
- Line Charts: Ideal for tracking changes or trends over time and illustrating the relationship between two or more variables.
- Bar Charts: Best for comparing quantities across different categories.
- Scatter Plots: Used to show the correlation between two variables plotted on parallel axes.
- Bubble Charts: Useful for depicting correlations involving three variables, with bubble size representing an additional data dimension.
- Treemaps: Effective for comparing proportions between categories using area size, optimizing space usage.
Intentional Design: Select the visualization type that best conveys the story you want to tell with your data.
4. Be Cautious with Pie Charts
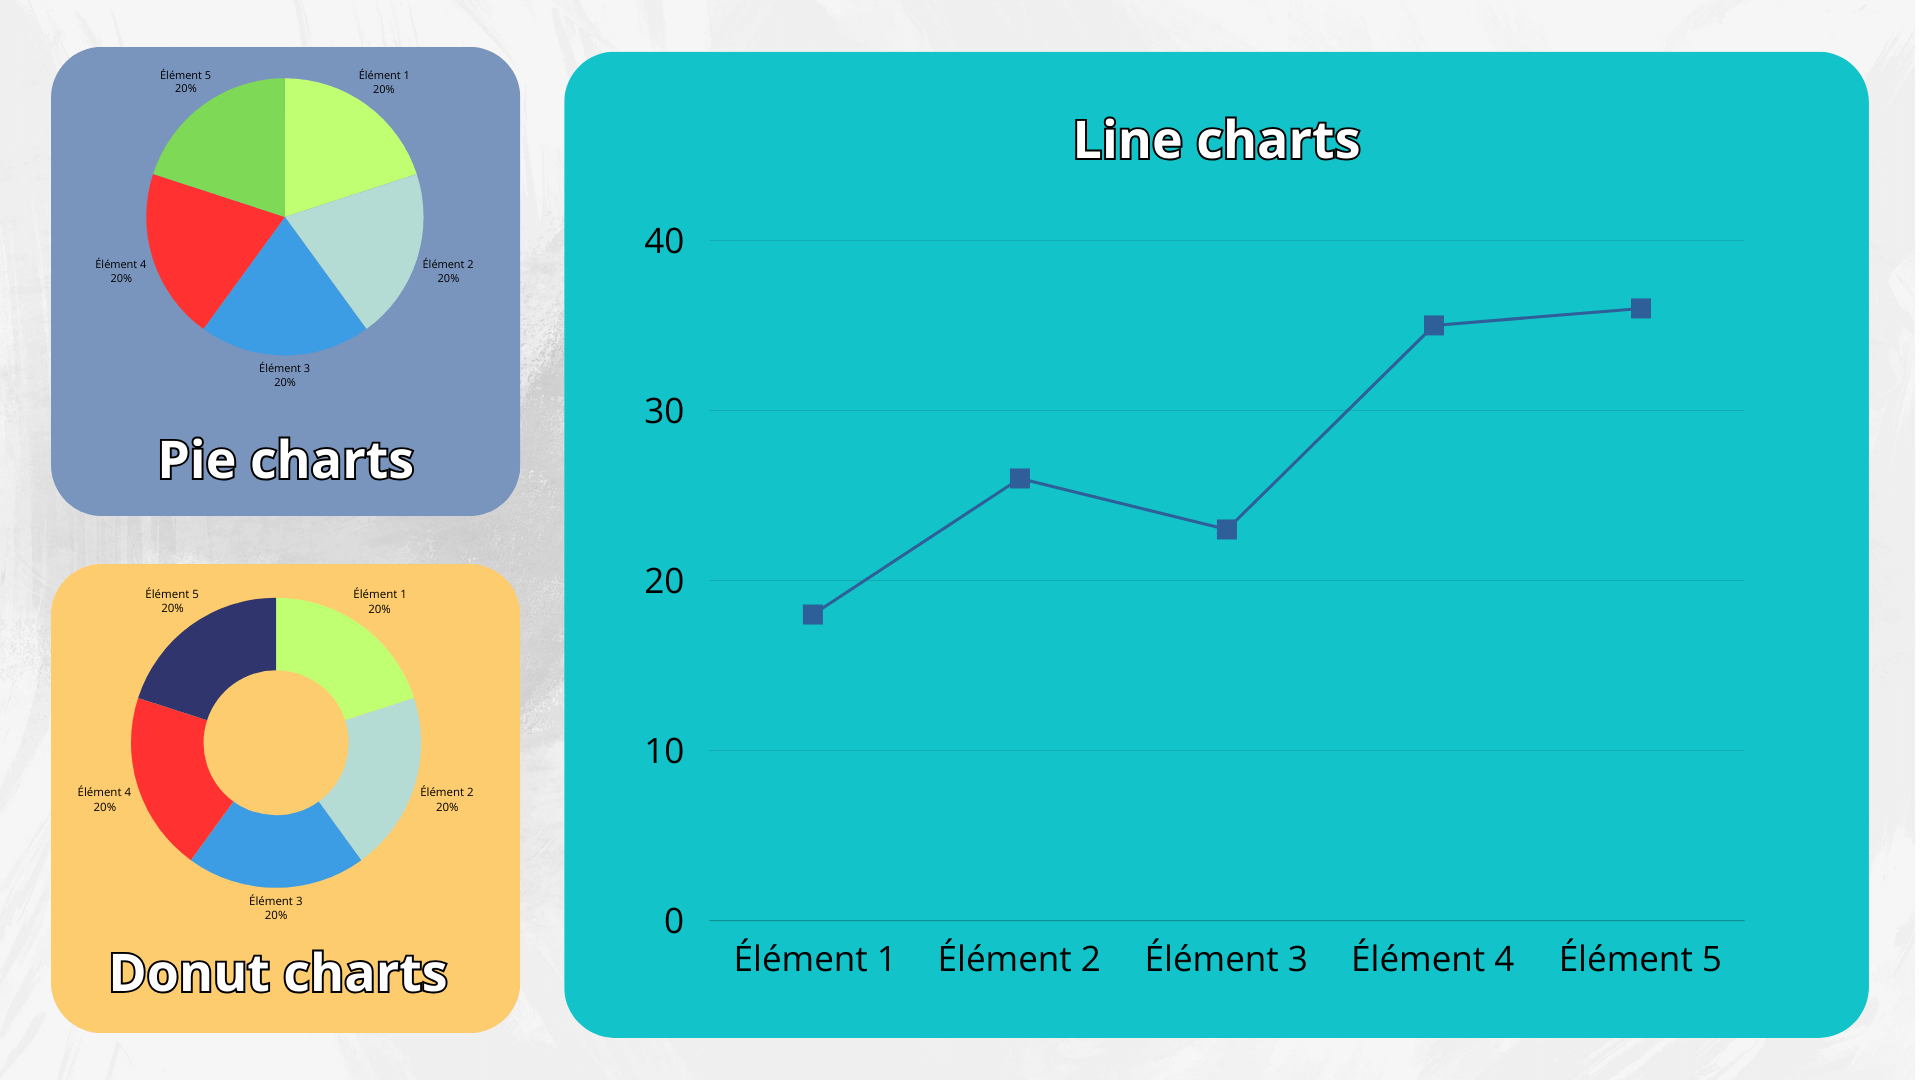
- Limitations of Pie Charts: Pie charts can be useful for showing proportions, but they often make it difficult to accurately compare segments, especially when there are many small slices.
- Alternative Options: Consider using donut charts or bar charts for a clearer representation of your data.
5. Tell a Story with Your Data
- Narrative Visualization: A strong data visualization does more than just display numbers; it tells a story. Contextualize your data with comparisons to goals or historical benchmarks to make it more meaningful.
- Guiding Action: Make it clear what actions should be taken based on the insights provided by the visualization
6. Make Your Visualizations Interactive
Modern users crave more than just visually appealing graphics—they want to interact with the data. Adding interactive elements to your visualizations can significantly boost user engagement.
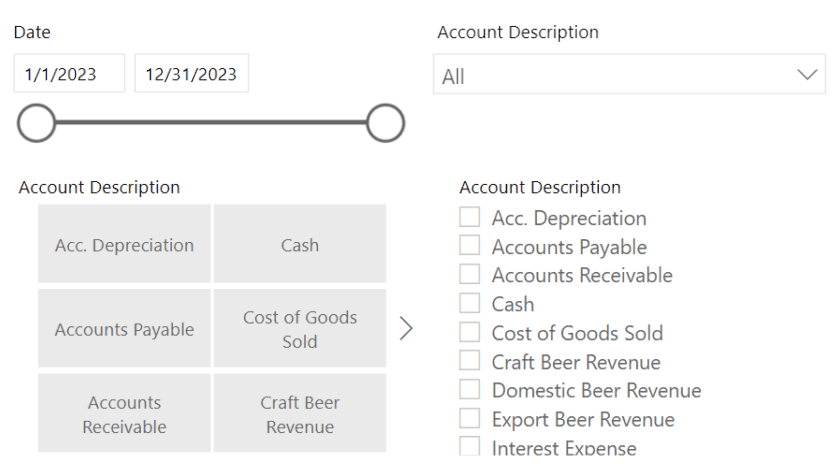
Features such as tooltips, filters, and drill-down options can transform static visuals into dynamic, user-driven experiences. For example, tooltips offer additional context or detailed information when users hover over specific data points, while filters allow exploration from different perspectives, helping to isolate trends or focus on particular data subsets.
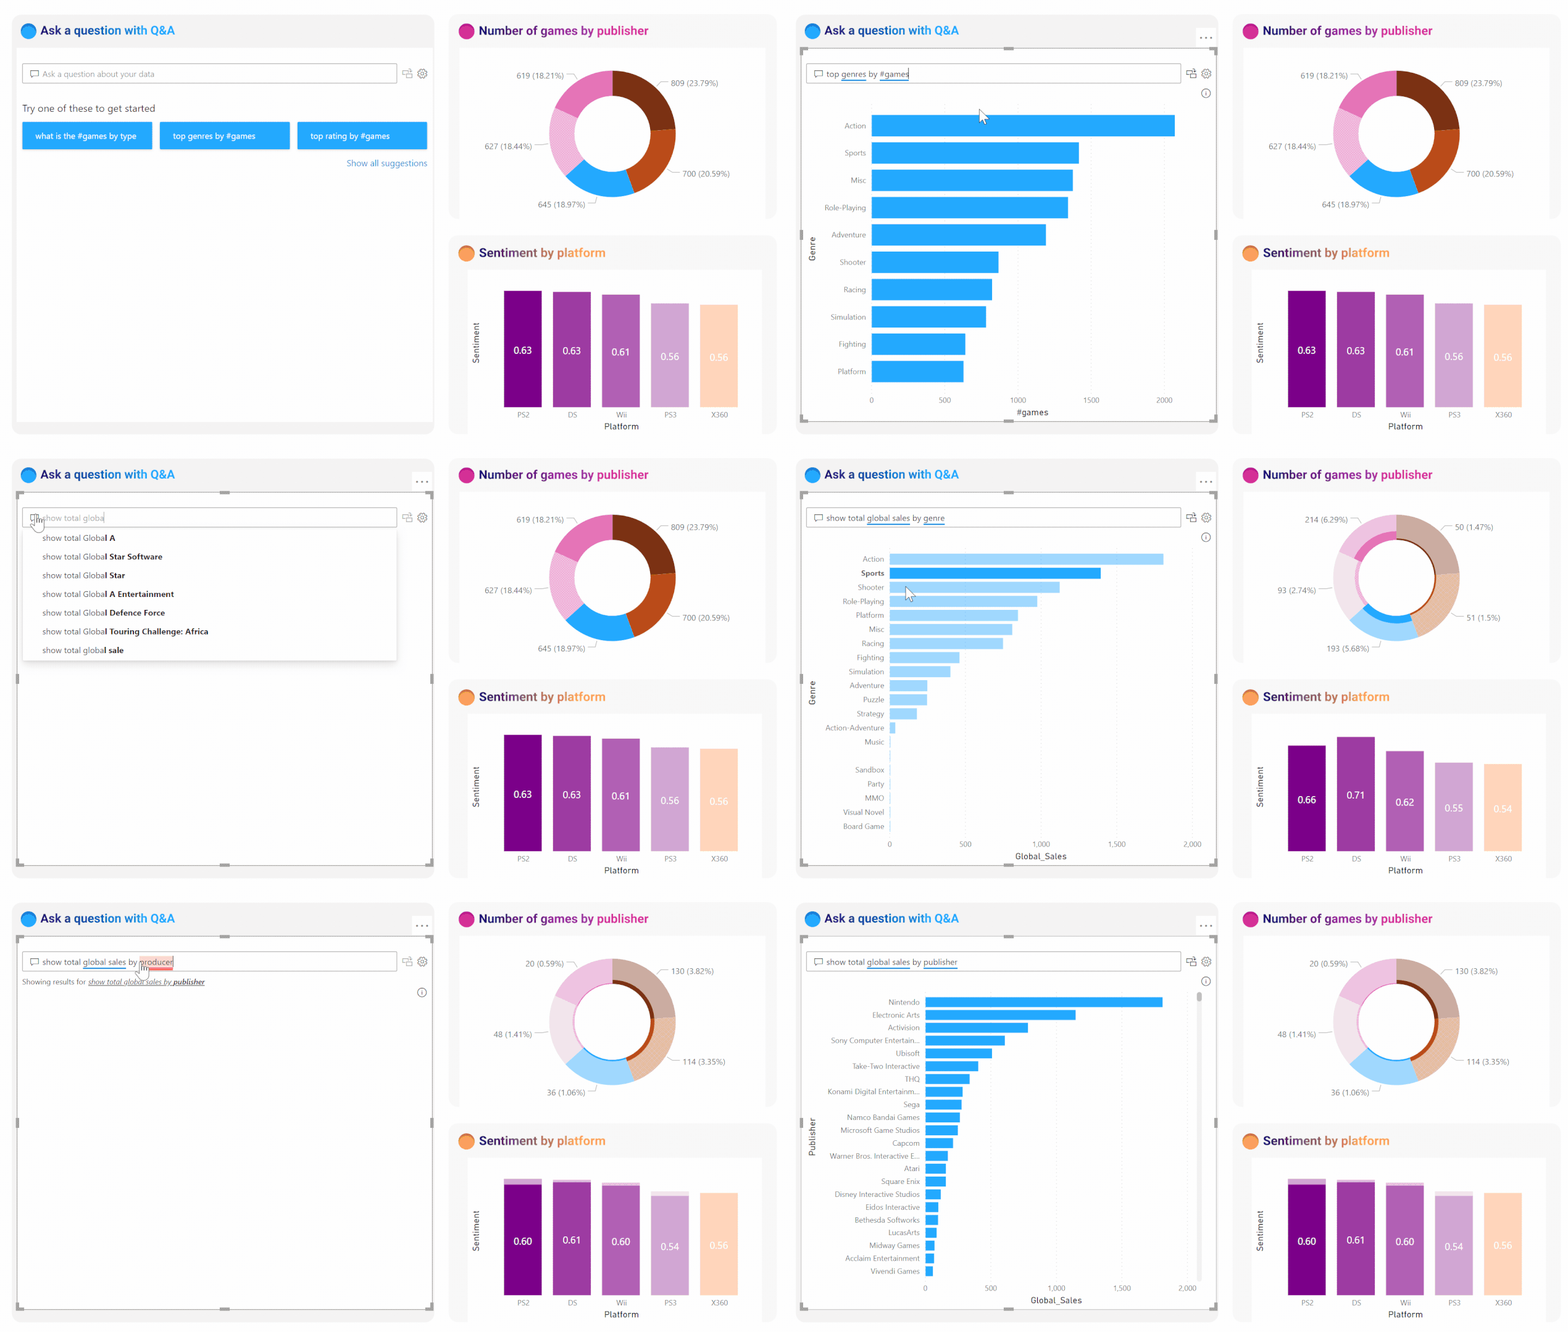
Beyond basic interactivity, consider leveraging data tools that offer AI-powered features. These tools can enable users to interact with data using natural language queries (through chatbots), predict outcomes, make forecasts, and more, creating a more engaging and insightful experience.
7. Follow Design Principles
- Consistent Design: Use consistent colors, fonts, and styles across your visualizations to create a cohesive and intuitive experienc.
- Effective Use of Color: Use color strategically to highlight important data points or to differentiate categories. Avoid using too many colors, which can lead to confusion.
8. Personalize the User Experience
- Customized Visuals: Tailor your visualizations to resonate with the specific interests and needs of your audience. Personalized visuals enhance understanding and make the data more relatable.
- Creative Design: Explore innovative ways to present your data, making sure it aligns with the audience's expectations while still being clear and effective.
9. Ensure Accessibility
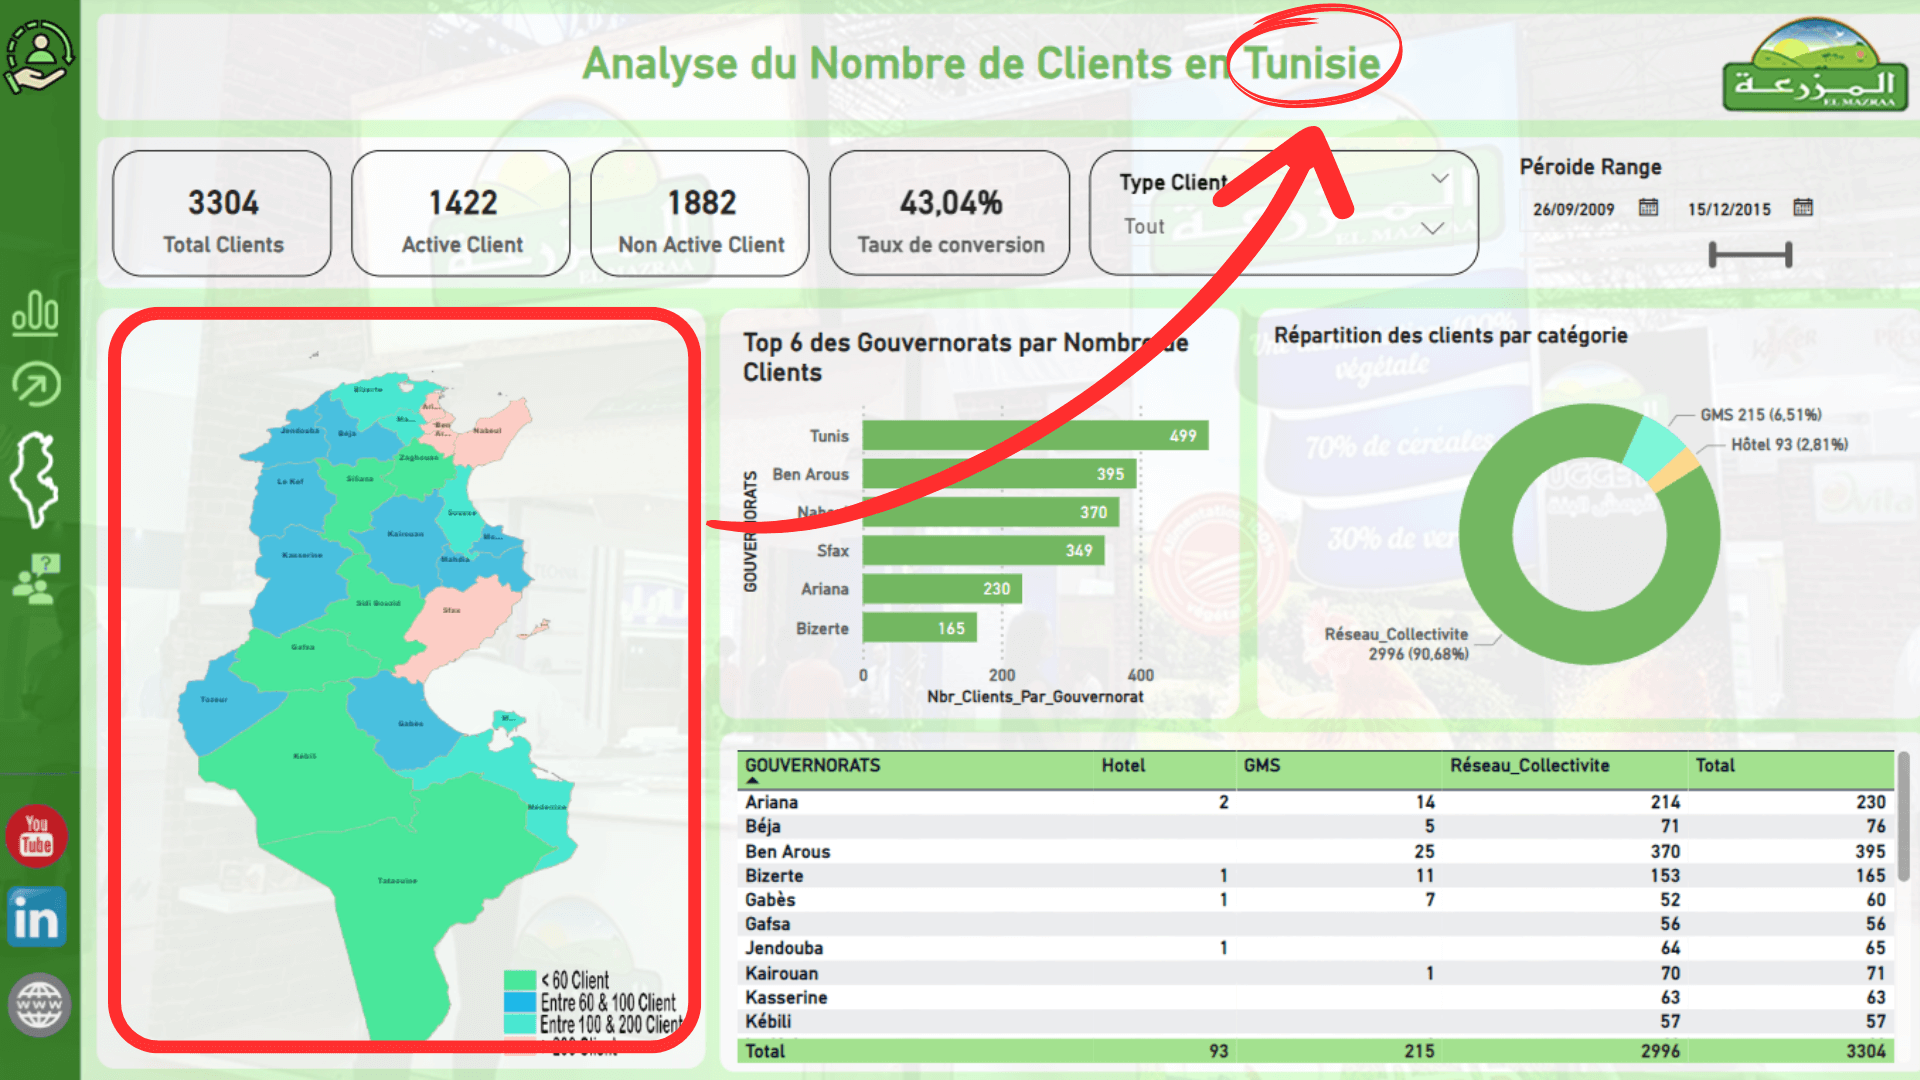
- Accessible Design: Make sure your visualizations are accessible to all users, including those with visual impairments. Use high-contrast color schemes, avoid problematic color combinations like red and green, and incorporate patterns to differentiate data points.
- Screen Reader Compatibility: Test your visualizations with accessibility tools to ensure they are navigable and understandable for all users.
10. Test and Iterate
- User Feedback: Regularly test your visualizations with real users to identify any areas of confusion or potential improvements.
- Continuous Improvement: Based on feedback, iterate on your designs to better meet the evolving needs of your audience, ensuring that your visualizations remain relevant and effective.
Conclusion
Effective data visualization is about more than just making your data look good; it's about communicating insights in a way that drives understanding and action. By following these best practices, you can create visualizations that are not only visually appealing but also powerful tools for decision-making.